
Pixel charts
Turn pictures into editable knitting and crochet charts.
Upload a photo, pixelate it, edit the grid, and keep your place while you work. The chart stays editable, private, and ready for your next project.
Your free account includes a Pixel Chart trial. Image conversion happens in your browser — the picture never leaves your device.
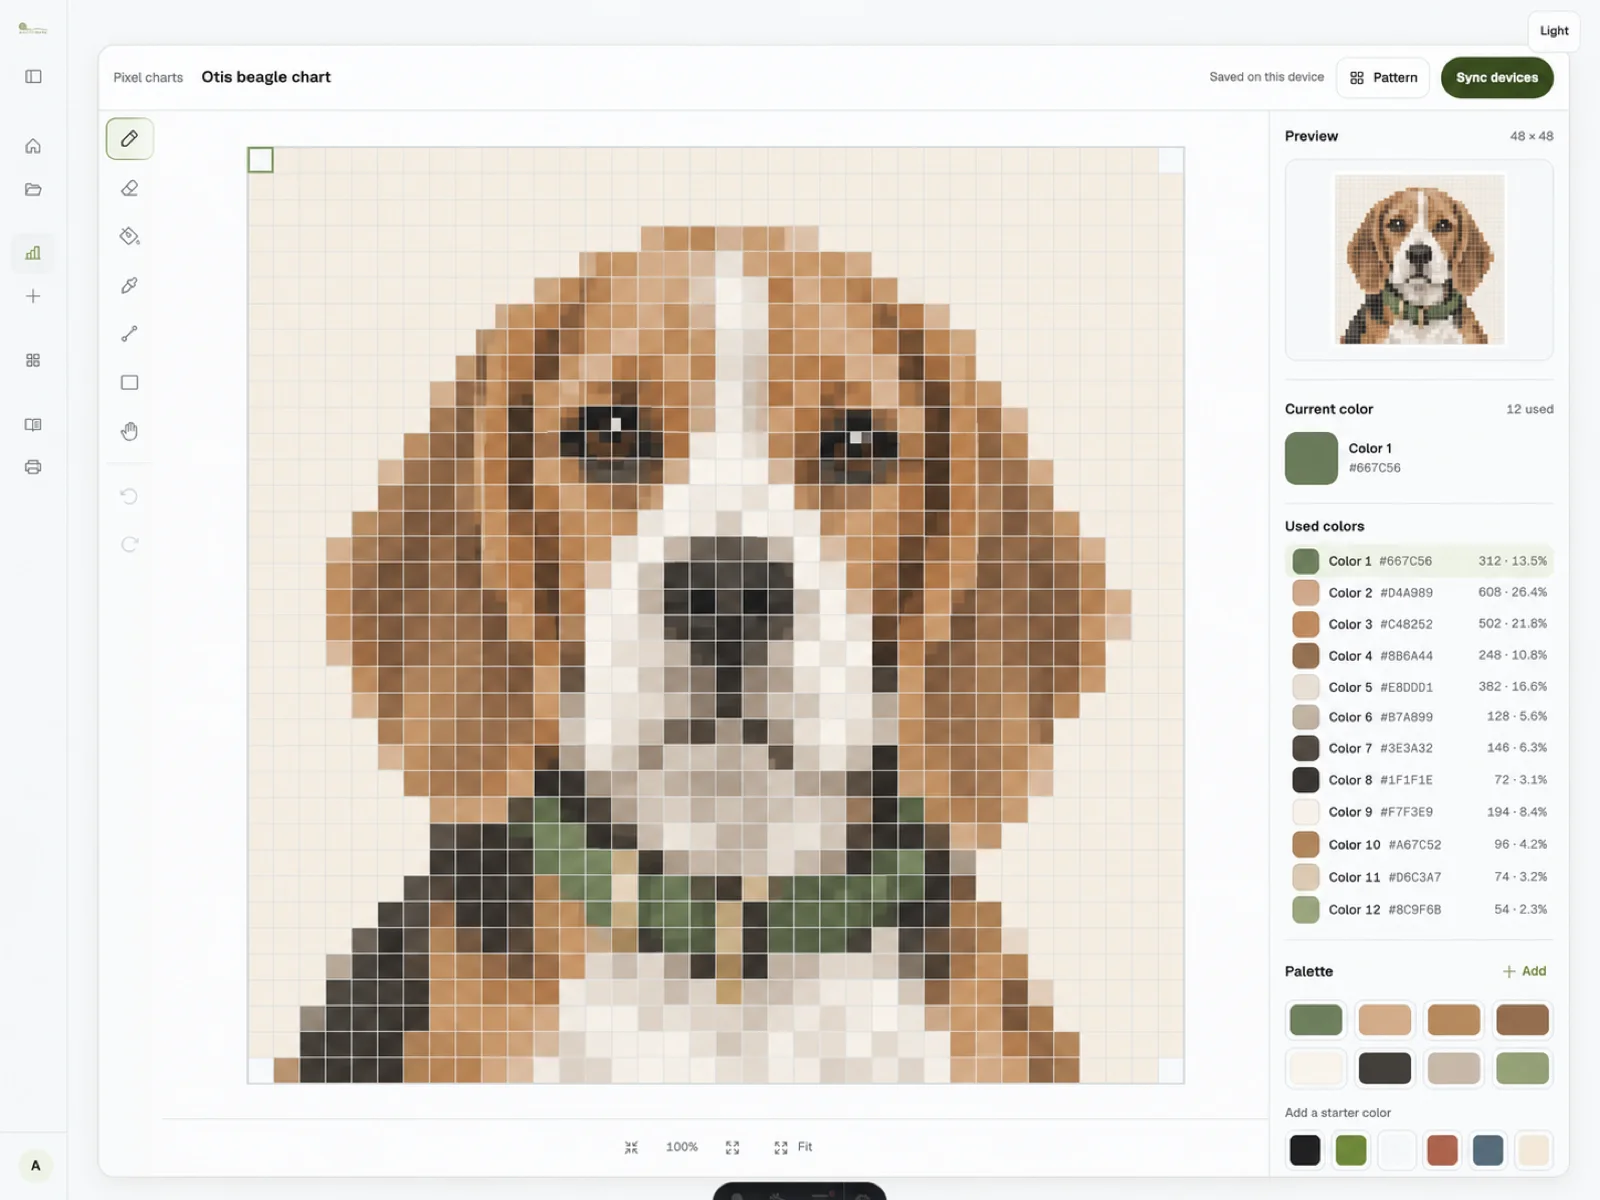
FlowHow it works
Upload, edit, work — three calm stages
Follow one real project from source photo to first row. Otis stays editable at every step.
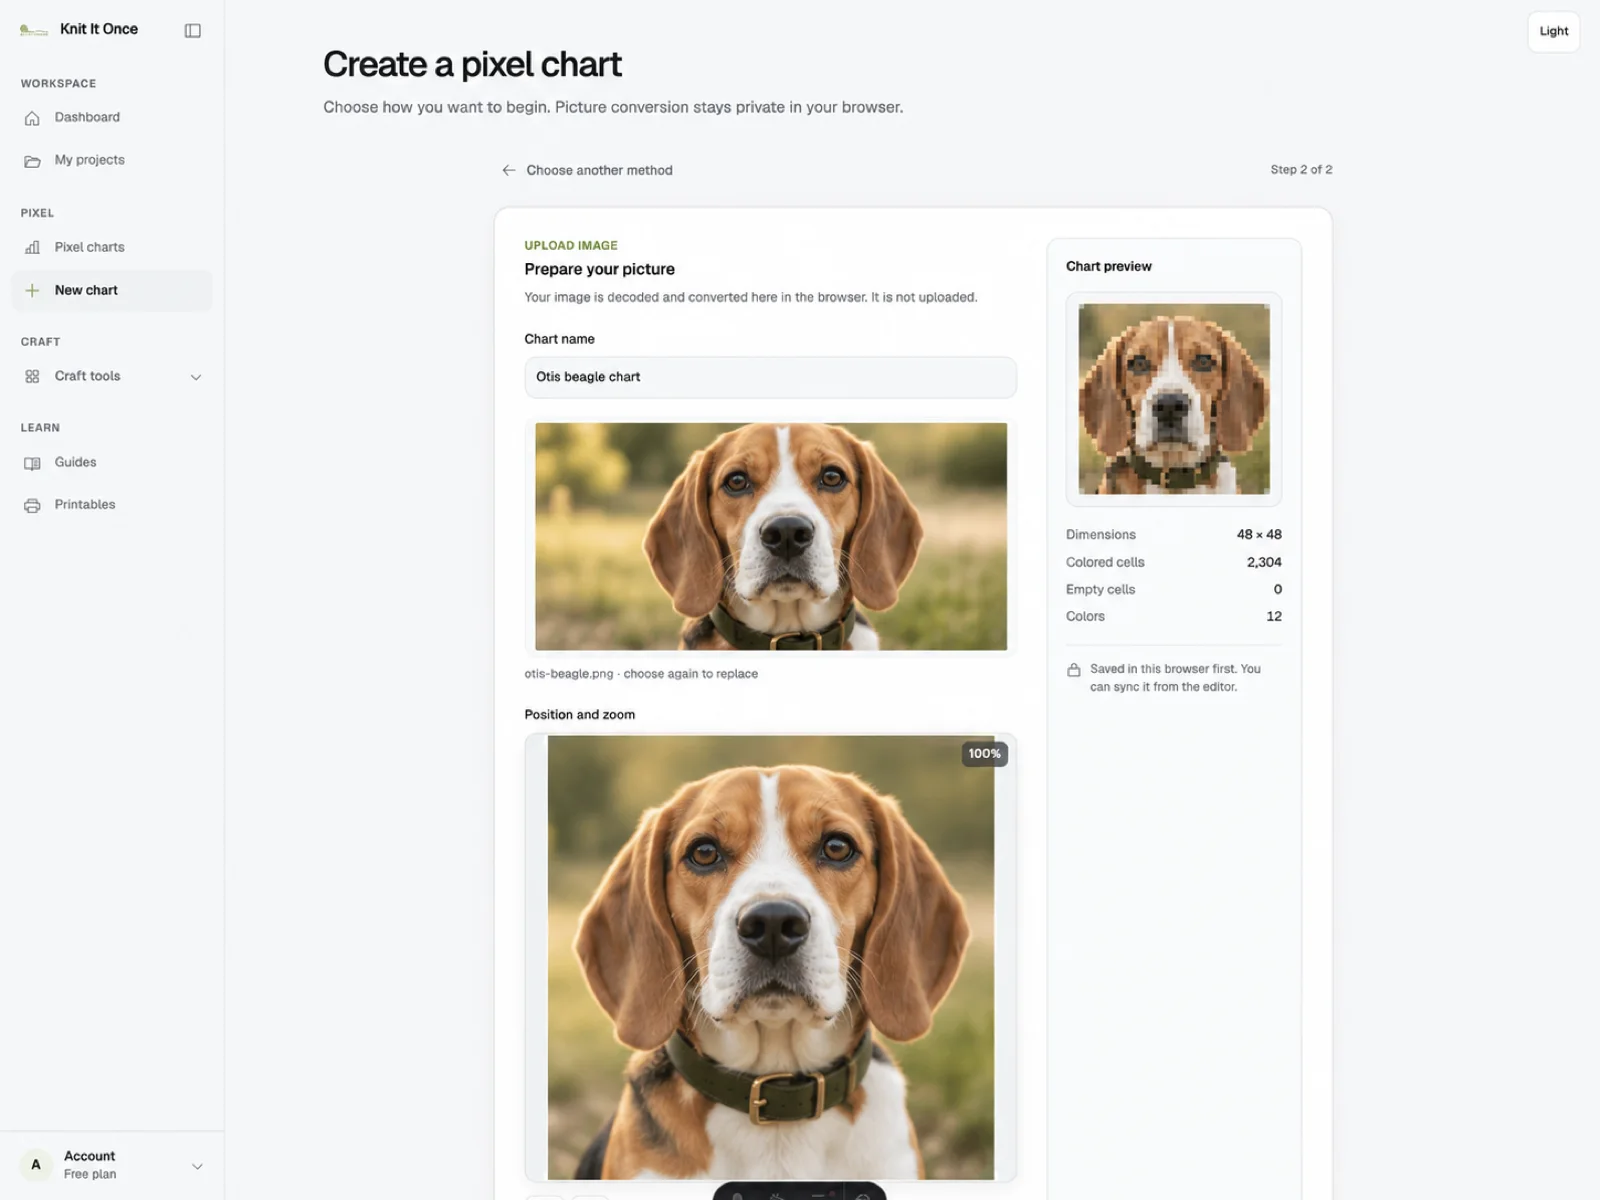
01Upload
Otis beagle chart · 48 × 48
Drop in a photo or motif — conversion happens in your browser.
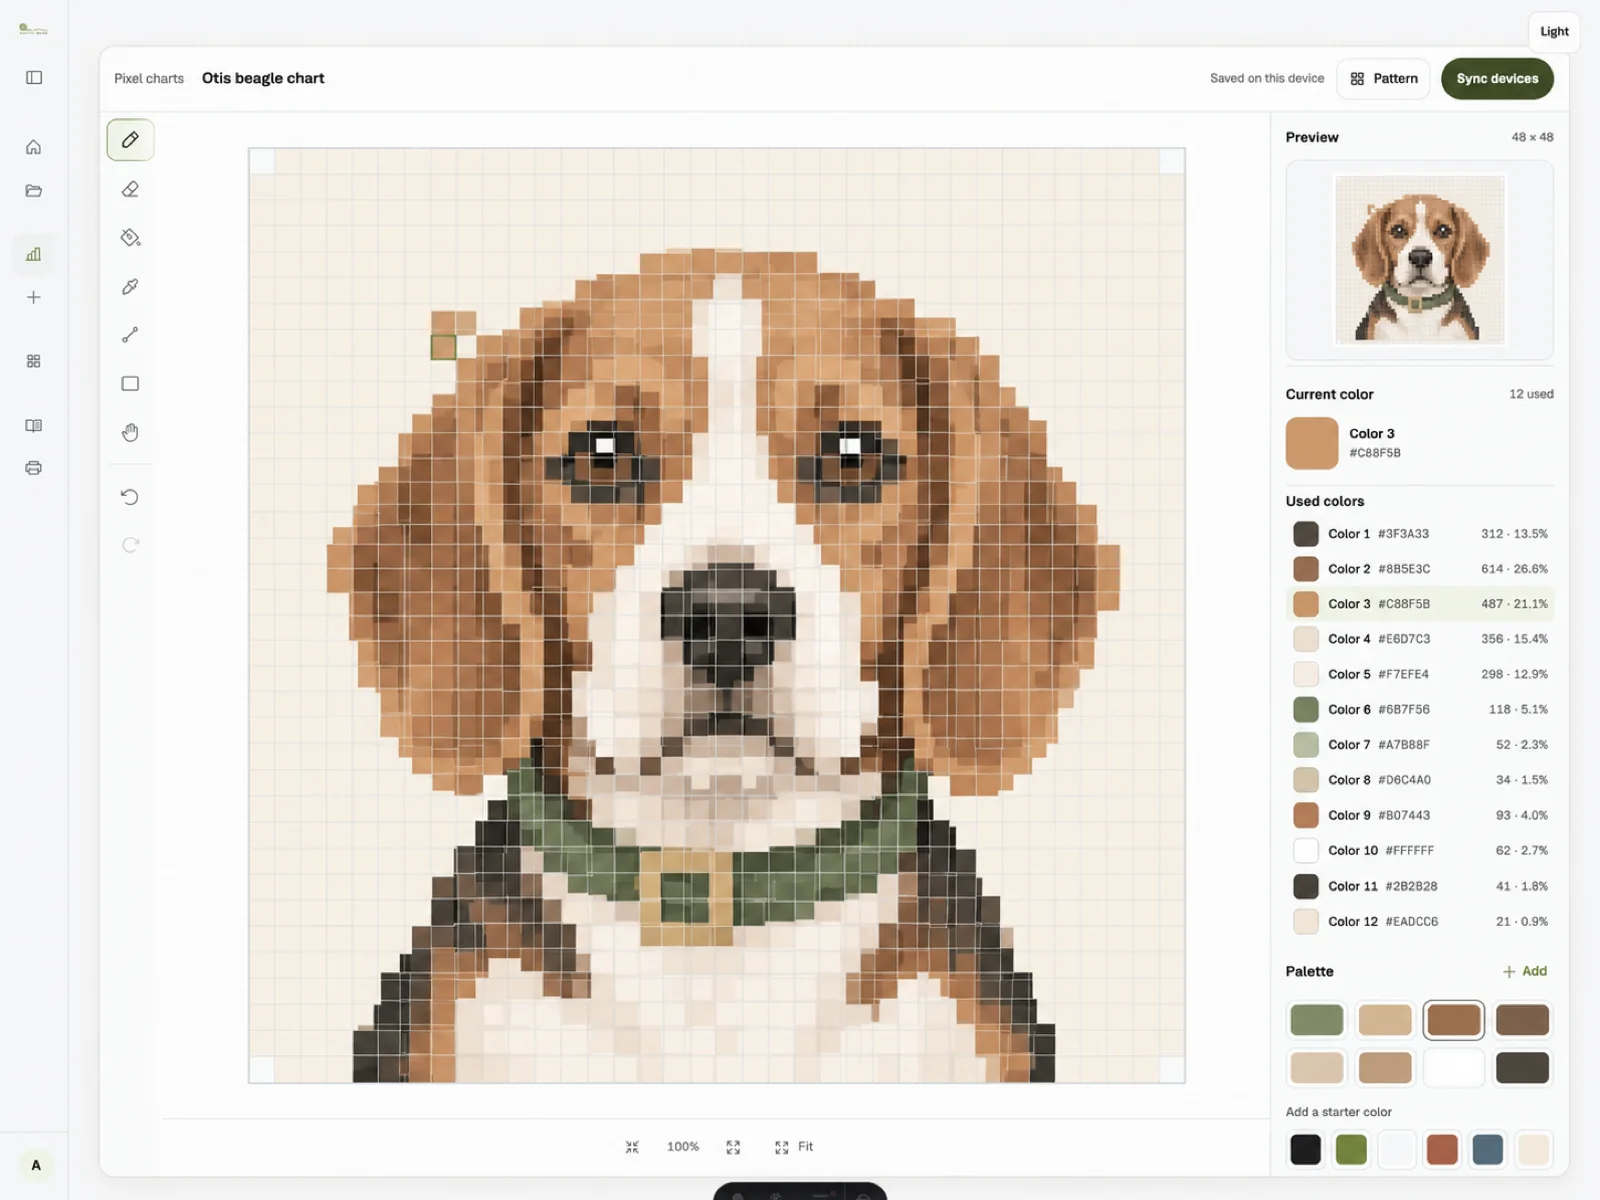
02Edit
Otis beagle chart · 48 × 48
Clean up the grid cell by cell, with undo and keyboard drawing.
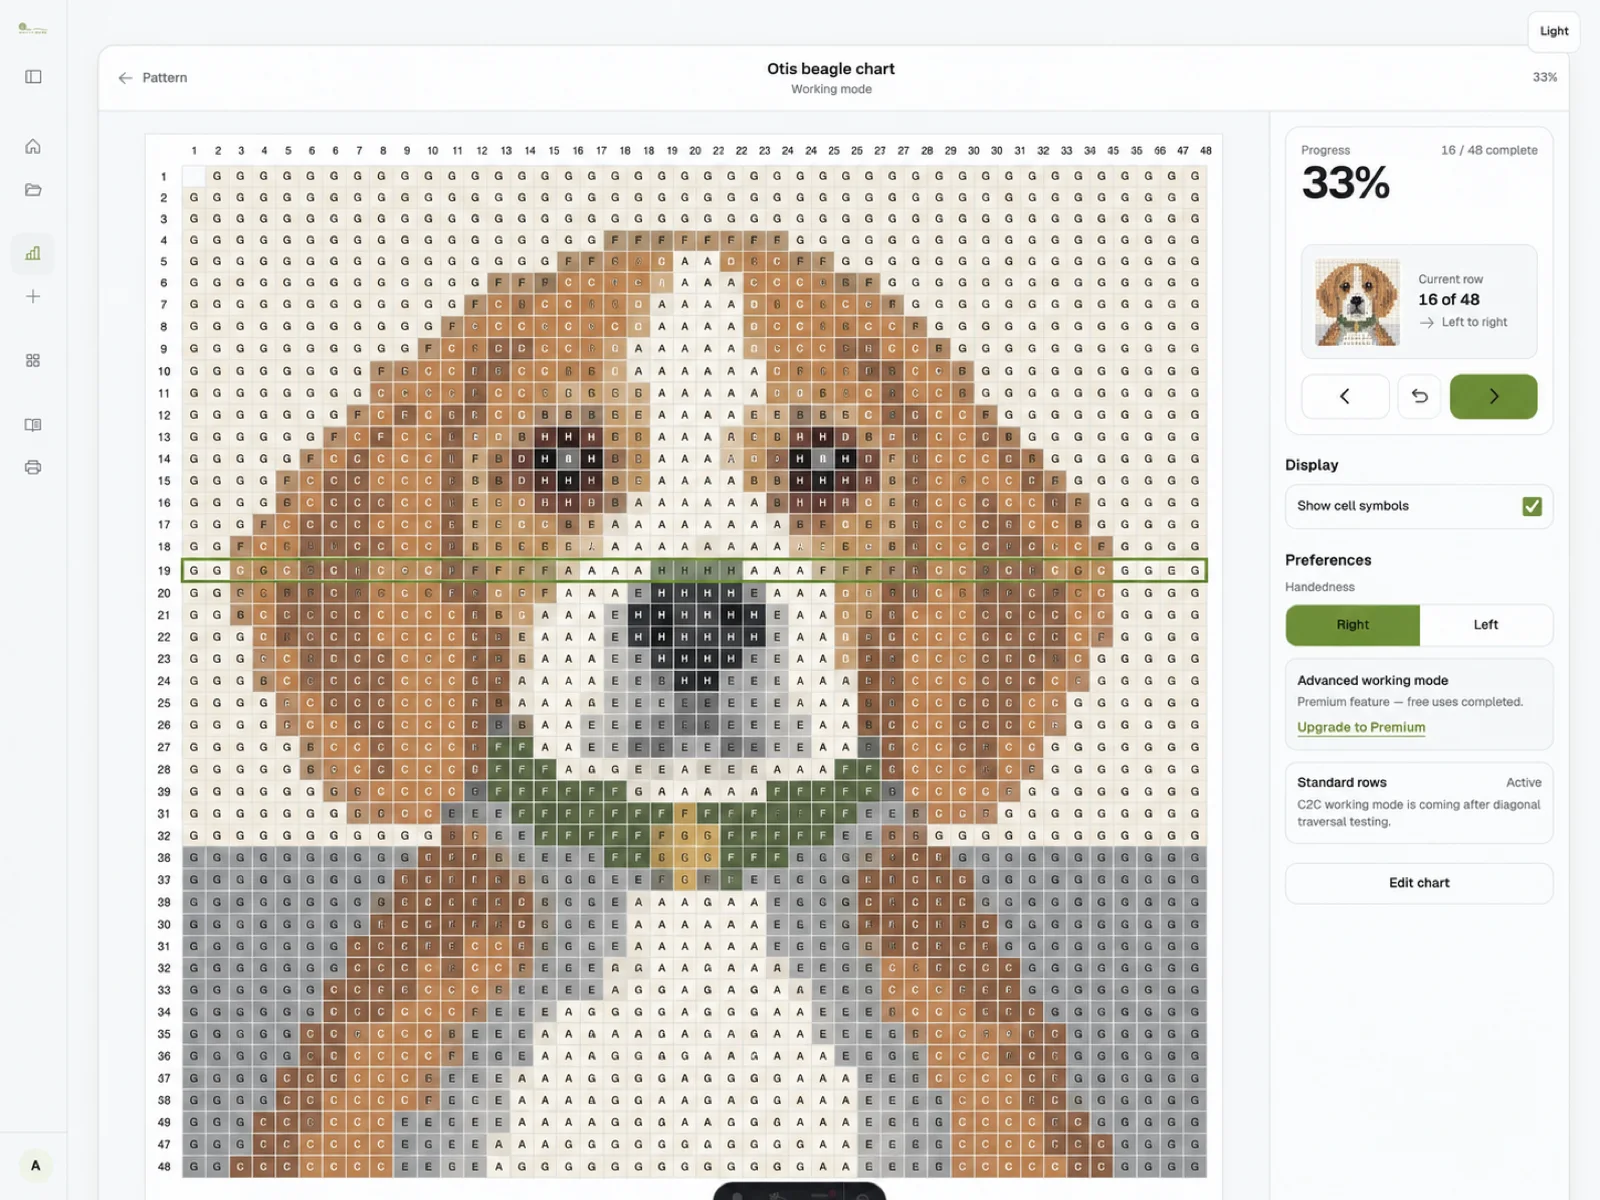
03Work
Otis beagle chart · 48 × 48
Work mode tracks rows, direction, and your place as you make.
What you get
Sized for real projects
Start with a small motif, then take the same calm editor into more detailed work.
| Feature | Free account | Premium |
|---|---|---|
| Chart size | 100 × 100 | 200 × 200 |
| Colours | 16 | 64 |
| Export | PNG · PDF | PNG · PDF · SVG |
PrivacyImages never leave your device.